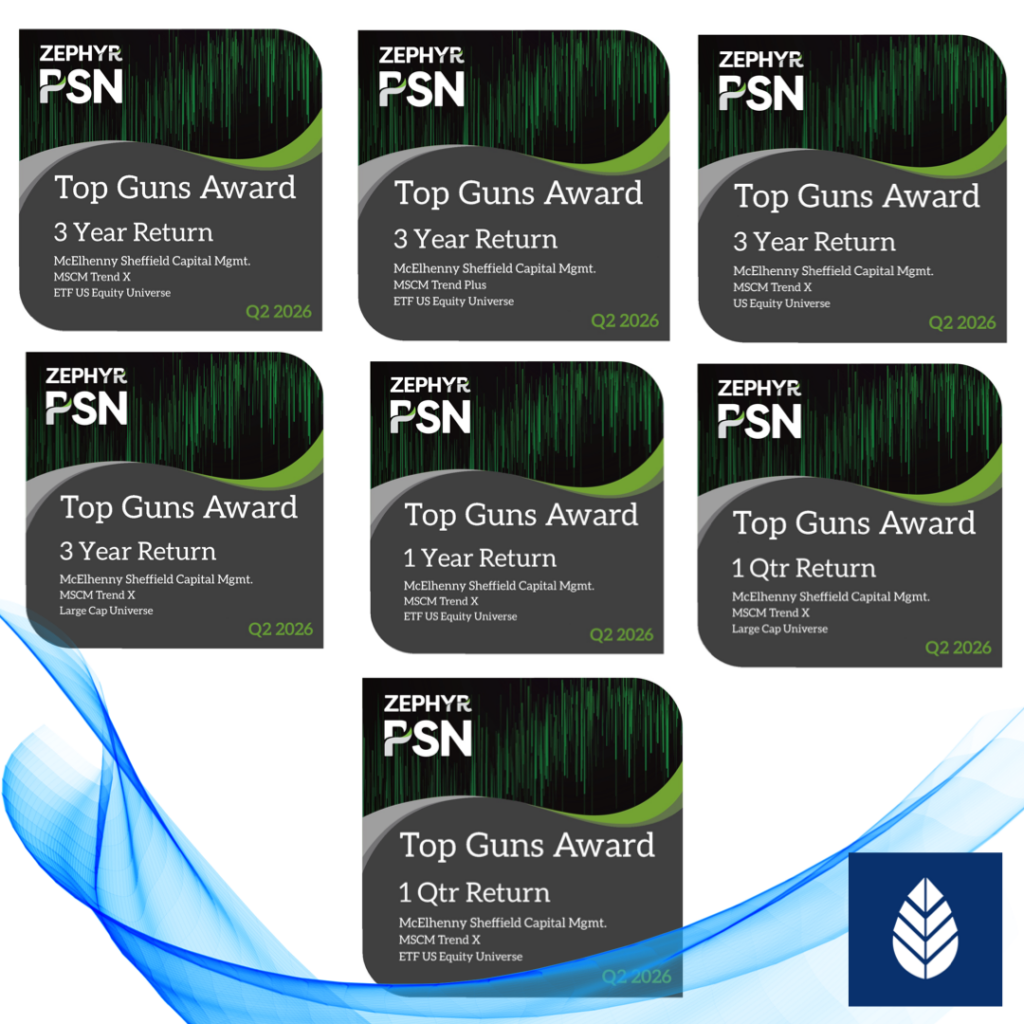
We are thrilled to have been recently recognized with PSN Top Guns status within Zephyr’s PSN manager database for Q2 2026 for MSCM’s Trend Plus and Trend X strategies.

MSCM was notified of its PSN Top Guns status on August 26, 2026. Visit www.mscm.net to learn more about us and how our strategies can fit into a well-diversified portfolio.

Note that past performance is not indicative of future results. Investing involves risk and principal loss is possible. 

Most recent quarterly returns and important disclosures: Trend Plus and Trend X. The Trend X strategy uses leveraged ETFs and the use of leverage in a strategy will increase volatility and can exacerbate the movements of the account values in both directions up and down, depending on market movements.

About the PSN Top Guns Awards 

The PSN Top Guns Award, created by Zephyr, is a distinguished quarterly ranking of top-performing ETF and separately managed account managers. A few was paid for the use of the ranking graphics. The list is an important reference point for asset managers, institutional investors, and allocators

IMPORTANT DISCLOSURES

This information is presented for illustrative purposes only. Past performance is not necessarily indicative of future performance. Investing involves risk and principal loss is possible.

McElhenny Sheffield Capital Management (MSCM) is a Registered Investment Adviser with the U.S. Securities and Exchange Commission (SEC). Registration does not imply a certain level of skill or training. Important information pertaining to MSCM’s advisory operation, services, risks, and fees is set forth in MSCM’s current Form ADV Part 2A brochure, a copy of which is available upon request or at www.adviserinfo.sec.gov or www.mscm.net.

MSCM claims compliance with the Global Investment Performance Standards (GIPS®). GIPS® is a registered trademark of CFA Institute. CFA Institute does not endorse or promote this organization, nor does it warrant the accuracy or quality of the content contained herein. MSCM has been independently verified for the period January 1, 2017 through December 31, 2025. The MSCM Trend Plus and Sector Rotation Composites have each had a performance examination for the periods January 1, 2017 through December 31, 2025. The Trend X Composite has had a performance examination for the period  May 1, 2017 through December 31, 2025. The TPSR Composite has had a performance examination for the period April 1, 2018 through December 31, 2025. The verification and performance examination reports are available upon request by contacting info@mscm.net.

All strategy performance results, including investment characteristics, shown in the presentation are net of the MSCM Trend Plus, Sector Rotation, and TPSR strategies’ highest model fee of a 1% annual management fee, applied 1/12th of 1% (0.0833%) each month and net of  the MSCM Trend X strategy’s highest model fee of a 2% annual management fee, applied 1/12th of 2% (0.1667%) each month, and for the Trend X strategy a 20% performance fee, applied quarterly to the net profits in the account and subject to a “high water mark.”  The net of fee strategy performance results are calculated by MSCM by deducting the strategy’s highest model fee from the gross of fee performance returns. Index and strategy returns are inclusive of dividends and reflect total return (TR). Index returns are not net of advisory fees, the indices are not actively managed, and it is not possible to invest directly in the index. Fees and expenses vary based on custodial relationships, trading costs, management fees, and other factors. Individual client results could significantly differ from the performance results being presented. The performance of client accounts can be more volatile at times and may not be comparable to the performance of any index. The charts, graphs, and index information shown are presented for illustrative purposes and should not be relied on to predict future movements of the market or for guidance on when to invest. Nothing in this presentation is intended to be relied on as investment, legal, or tax advice. Investors should consult their tax advisor or legal counsel for advice and information concerning their particular situation.

There can be no assurance that the strategy will be implemented as designed, or profitable, or that clients will not lose money. The tactical strategies use a variety of market indicators and stop levels that seek to identify upward or downward trends in the U.S. equity markets. If an indicator or stop level fails to detect significant downturns in the market, the strategy will continue to be exposed to underlying positions that could lose value during such downward periods. Similarly, if the indicators fail to timely identify a reversal of a downward trending market, the strategies will continue to be exposed to defensive exchange traded funds (“ETFs”) at a time when there is significant appreciation in the equity markets. Either scenario could result in the strategies underperforming other strategies that do not employ these strategies. There can be no guarantee the tactical strategies will correctly or timely identify the industries, sectors, or asset classes that will outperform during a given quarter or that the strategies will correctly or timely identify market trends. The tactical strategies invest in other investment companies and ETFs which result in higher and duplicative expenses. Investing in ETFs are subject to risks that the market price of the shares will trade at a discount to its net asset value (“NAV”), an active secondary trading market will not develop or be maintained, or trading will be halted by the exchange in which they trade. Brokerage commissions will reduce returns.

The Standard & Poor’s 500® Index (S&P 500 Index) includes 500 leading companies listed on U.S. stock exchanges. The Nasdaq Composite Index (Nasdaq Comp.) includes more than 3,000 stocks listed on the Nasdaq Stock Market and, along with the S&P 500 Index, is one of the most followed broad-based stock market indices in the U.S. The Benchmark 60/40 Index (Benchmark 60/40) is a blended index calculated by YCHARTS with a 60% allocation to the S&P 500 Index and a 40% allocation to the Bloomberg Aggregate U.S. Bond Index, a broad-based fixed income index considered to be representative of the U.S. fixed income market. The Benchmark 60/40 represents a traditional “balanced” investment allocation for a U.S. investor of 60% stocks and 40% bonds. Annualized volatility, a common measure of risk, is the standard deviation of monthly returns. Maximum Drawdown reflects maximum peak-to-trough decline in an investment, security, or index over a specific time period, as measured by the difference in the highest value during the time period and the subsequent lowest value during the time period. Alpha is the excess return of an investment relative to the return of a benchmark index. Beta is a measure of a security’s or portfolio’s systematic risk, indicating its volatility relative to the overall market (e.g., S&P 500 Index). R-squared is the proportion of a strategy’s price movements that can be explained by movements in a benchmark index. Sharpe Ratio measures the average return in excess of the risk-free rate per unit of volatility or total risk. Sortino Ratio is like Sharpe but focuses on downside risk. Treynor Ratio measures the return earned in excess of the risk-free rate per unit of systemic or market risk. Calmar Ratio evaluates the return of an investment over the risk of its maximum drawdown. A Chartered Financial Analyst (CFA®) charter is a designation given to those who have completed the CFA® Program and completed acceptable work experience requirements. The CFA Program is a three-part exam that tests the fundamentals of investment tools, valuing assets, portfolio management, and wealth planning. The Certified Financial Planner (CFP®) certification is a professional certification for financial planners conferred by the Certified Financial Planner Board of Standards. To receive authorization to use the designation, a candidate must meet education, examination, experience, and ethics requirements and pay an ongoing certification fee..

About the Author Grant Morris

Grant Morris, CFA, CFP®, specializes in tactical investment strategies and technical analysis for McElhenny Sheffield Capital Management (www.mscm.net). He joined MSCM after developing a rules-based trend-following strategy to manage his personal investable assets. Mr. Morris has vast experience serving clients in the financial-services industry, previously as a consultant, and now in managing multiple tactical ETF strategies for MSCM clients and other RIA firms.